Contents
- 🗺️ What is Geologic Mapping?
- 🧑🔬 Who Uses Geologic Maps?
- 🛠️ The Geologist's Toolkit
- 📊 Data & Interpretation
- 🌍 Historical Context
- 💡 Key Concepts in Mapping
- 🚧 Challenges & Controversies
- 🚀 The Future of Geologic Mapping
- 💰 Cost & Accessibility
- ⭐ User Reviews & Ratings
- 🆚 Similar Disciplines
- 🚀 Getting Started
- Frequently Asked Questions
- Related Topics
Overview
Geologic mapping is the fundamental practice of representing the distribution, composition, and relationships of rock units and geologic structures on the Earth's surface and subsurface. It's not just about drawing lines on a map; it's a rigorous scientific process that integrates field observations, subsurface data (like seismic surveys and well logs), and remote sensing to create a visual narrative of Earth's history. These maps are indispensable tools for understanding geological processes, locating valuable mineral and energy resources, assessing natural hazards like earthquakes and landslides, and informing infrastructure development. The accuracy and detail of a geologic map directly impact the success of exploration, engineering, and hazard mitigation projects worldwide.
🗺️ What is Geologic Mapping?
Geologic mapping is the fundamental practice of visually representing the Earth's subsurface structure and composition. It's not just about drawing lines on a page; it's an interpretive art and science that synthesizes field observations, analytical data, and theoretical understanding. These maps use distinct colors, patterns, and symbols to denote different rock units, strata, and structural elements like fault lines and folds in rock. The primary goal is to convey the three-dimensional arrangement of geological materials and features at or near the Earth's surface, providing a critical blueprint for understanding our planet's history and resources.
🧑🔬 Who Uses Geologic Maps?
The utility of geologic maps extends far beyond academic curiosity. Exploration firms rely on them to pinpoint potential deposits of mineral resources, hydrocarbons, and water resources. Engineers and planners use them to assess ground stability for infrastructure projects like dams, bridges, and buildings, mitigating risks associated with landslides or seismic activity. Environmental professionals employ them to understand contaminant pathways and manage geohazards. Even archaeologists can glean insights into past landscapes and resource availability.
🛠️ The Geologist's Toolkit
The traditional geologist's toolkit for field mapping is surprisingly analog, though increasingly augmented by digital technologies. Essential items include a geological compass for measuring strike and dip, a geologist's hammer for collecting samples, a hand lens for detailed examination of minerals, and sturdy notebooks for recording observations. Historically, maps were drafted on paper, often using standardized field note cards. Today, GPS units and ruggedized tablets are commonplace, allowing for real-time data capture and integration with Geographic Information Systems (GIS).
📊 Data & Interpretation
Geologic mapping is inherently an interpretive process. Field observations, such as the type of rock encountered, its texture, and its relationship to adjacent units, are crucial. These are supplemented by analytical data from lab tests of rock and mineral samples, geophysical surveys (like seismic or gravity data), and satellite imagery. The geologist synthesizes all this information, often making educated inferences about features not directly observable, to construct a coherent geological picture. This synthesis is what gives a geologic map its true value, transforming raw data into actionable knowledge.
🌍 Historical Context
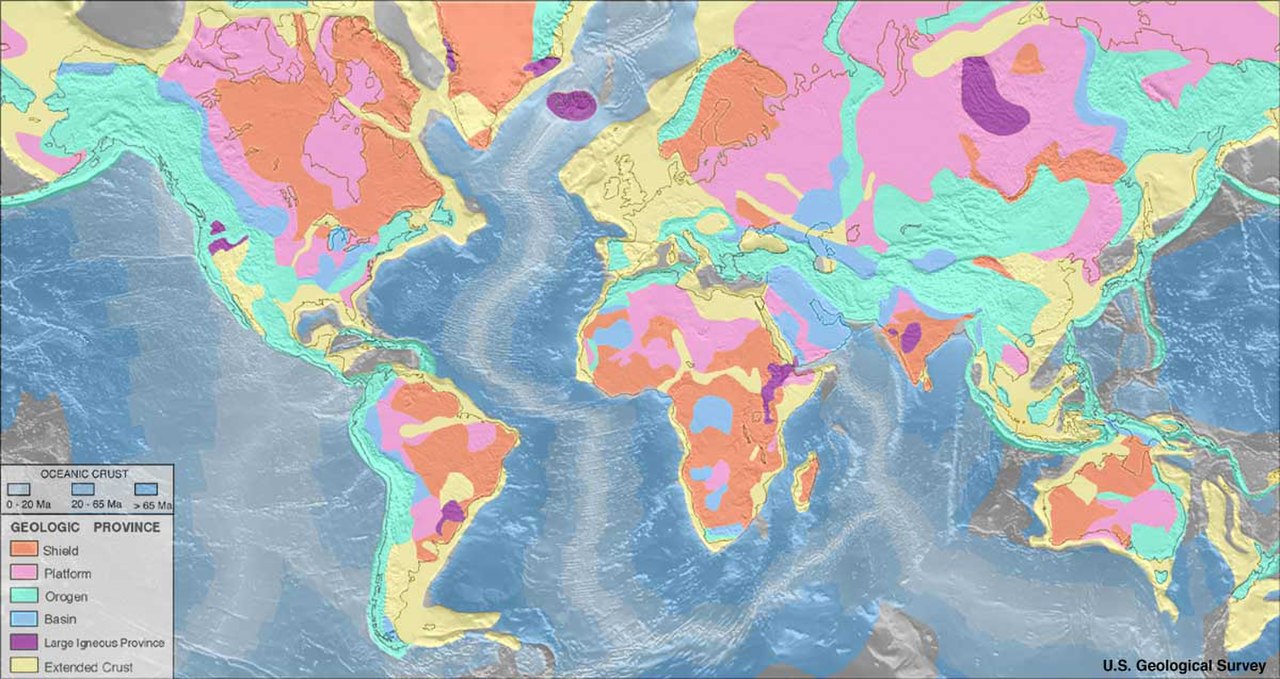
The practice of geologic mapping has deep historical roots, evolving alongside the science of geology itself. Early geological surveys in the 18th and 19th centuries, such as those led by William Smith in England, laid the groundwork for systematic mapping. These pioneers recognized the importance of stratigraphy and the ability to correlate rock layers across distances. The development of standardized symbols and color schemes, often codified by national geological surveys like the USGS, has facilitated consistency and comparability of maps over time and across different regions.
💡 Key Concepts in Mapping
Understanding geologic maps requires grasping a few key concepts. Stratigraphic units are the fundamental building blocks, representing layers of rock deposited over time. Structural features like faults (fractures where movement has occurred) and folds (bends in rock layers) reveal the stresses and strains the Earth's crust has undergone. Strike and dip measurements are critical symbols indicating the orientation of planar geological features in three dimensions. Geochronological data provides absolute age constraints for these units and events, anchoring the geological timeline.
🚧 Challenges & Controversies
Geologic mapping is not without its challenges and controversies. The inherent subjectivity in interpreting complex geological relationships means that different geologists might produce slightly different maps of the same area. The resolution of maps is also a limitation; a map at a 1:100,000 scale cannot depict features smaller than a certain size, leading to generalizations. Debates often arise regarding the precise age or origin of certain rock units, or the interpretation of complex tectonic environments. Furthermore, the cost and accessibility of high-quality mapping data can be a point of contention, particularly for smaller organizations or developing regions.
🚀 The Future of Geologic Mapping
The future of geologic mapping is increasingly digital and data-driven. Advancements in AI and machine learning are being applied to analyze vast datasets from remote sensing, seismic surveys, and well logs, accelerating the mapping process and potentially revealing patterns previously unseen. 3D modeling software allows for more sophisticated visualization and analysis of subsurface structures, moving beyond traditional 2D representations. The integration of real-time sensor data and the development of autonomous mapping systems promise to further enhance the speed, accuracy, and scope of geologic mapping efforts.
💰 Cost & Accessibility
The cost of obtaining detailed geologic maps varies significantly. Many national geological surveys, like the GSC or the BGS, offer a substantial portion of their data and maps for free online. However, specialized or highly detailed maps, particularly those generated for specific exploration projects or proprietary research, can be expensive. Accessing raw data or commissioning new mapping can involve significant costs, ranging from thousands to millions of dollars depending on the scale, complexity, and location of the area being studied. Open data initiatives are crucial for democratizing this information.
⭐ User Reviews & Ratings
User feedback on geologic maps often centers on clarity, accuracy, and usability. Geologists praise maps that are well-organized, use intuitive symbology, and are supported by comprehensive metadata and reports. GIS users value maps that are easily integrated into digital workflows and are available in standard formats. Conversely, users express frustration with outdated maps, ambiguous symbols, or a lack of detailed explanations. Ratings, where available, typically reflect the perceived reliability and practical utility of the map for its intended purpose, with maps from reputable national surveys generally receiving high marks.
🆚 Similar Disciplines
Geologic mapping shares common ground with related disciplines but maintains distinct focuses. Topographic maps focus on surface elevation and landforms, providing the 'where' but not the 'what' beneath. Soil surveys detail the uppermost layer of the Earth's crust, crucial for agriculture but lacking the depth of geological insight. Geophysical methods provide indirect subsurface data that often informs geologic maps but doesn't represent it directly. While hydrogeological maps specifically chart groundwater systems, they are often derived from or integrated into broader geologic maps.
🚀 Getting Started
To engage with geologic mapping, start by exploring the resources provided by your national geological survey. Most offer extensive online portals with downloadable maps and data. For practical experience, consider taking introductory university geology programs or participating in field trips. Familiarize yourself with Geographic Information System software like ArcGIS or QGIS, as these are indispensable tools for working with modern geologic map data. If you're interested in a specific region, search for published geologic maps and reports pertaining to that area to understand its known geological framework.
Key Facts
- Year
- Late 18th Century
- Origin
- William Smith's pioneering work in stratigraphy and canal building in England.
- Category
- Earth Sciences
- Type
- Field of Study
Frequently Asked Questions
What is the difference between a geologic map and a topographic map?
A topographic map shows the shape and elevation of the Earth's surface using contour lines, representing landforms. A geologic map, on the other hand, depicts the types of rocks and geological structures (like faults and folds) beneath the surface. While they can be overlaid, their primary focus is different: topography is about surface relief, while geology is about subsurface composition and history.
How are colors used on geologic maps?
Colors on geologic maps are standardized to represent different geologic time units or rock formations. For instance, a specific shade of red might consistently represent Cretaceous-age sedimentary rocks across multiple maps from the same survey. These color schemes are typically explained in the map's legend, which is crucial for accurate interpretation. The goal is to provide a quick visual distinction between different geological units.
What does 'strike and dip' mean on a geologic map?
'Strike' is the compass direction of the line formed by the intersection of a rock layer or geological feature with a horizontal plane. 'Dip' is the angle and direction of the steepest inclination of that same feature from the horizontal. These measurements, often shown with specific symbols on maps, are vital for understanding the 3D orientation and structure of rock formations, indicating how they have been tilted or deformed.
Can I use a geologic map to find valuable minerals?
Yes, geologic maps are fundamental tools for mineral prospectors and companies. They highlight areas with rock types and geological structures known to host specific types of mineral deposits. While a map won't point directly to a gold nugget, it will indicate regions where geological conditions are favorable for its presence, guiding further, more detailed exploration efforts.
Are geologic maps always accurate?
Geologic maps represent the best interpretation of available data at the time of their creation. Accuracy depends on the quality and quantity of field observations, analytical data, and the skill of the geologist. Older maps may be less accurate due to limited technology or understanding. Modern maps, especially those incorporating geophysical data and GIS, tend to be more precise, but interpretation always involves some degree of uncertainty, particularly in complex geological settings.
Where can I download free geologic maps?
Many national geological surveys offer free access to their maps and data. Key sources include the USGS website, the GSC website, the BGS website, and similar organizations in other countries. These agencies typically provide maps in various digital formats, often compatible with GIS applications.